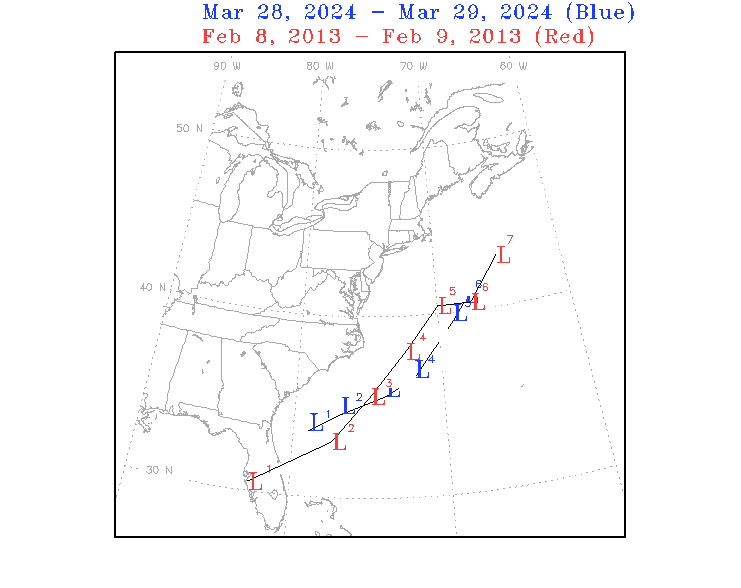
Given the positions and pressures of an impending East Coast winter storm as forecasted by the NOAA Global Forecast System (GFS) model, the historical (1950-1007) climatology of more than 700 East Coast winter storms is screened to identify the five most similar storms based on their tracks and pressure observations. The map on the left shows the track of the forecast storm in blue and that of the historical storm in red. The numbers plotted along each track relate the position of the storm to corresponding storm surges which can be viewed by selecting a tide gauge from the pull down menu on the right. Only those gauges with available data for the historical storm are included in the menu. In some cases no tide data are available. The surge plots are centered on the highest storm surge associated with each storm. In many cases the surge data do not correspond with all plotted storm positions. The omitted values are always less than those displayed on the surge plot and are typically less than the median historical storm surge. Clicking on the map displays a table that includes storm coordinates and atmospheric pressure data. Likewise, clicking on the storm surge plot provides tabular tide data. The pull down menu on the left can be used to switch to a different analogue storm. The storms are listed from most similar to least similar, so that the analogue storm at the top of the list (displayed by default) is the most similar to the forecast storm.
This product was created by Ethan David Peck.
|
|
 Home |
 Storm Climatology |
 Analogue Storm Tracks |
 Storm Frequency Outlook |
 Current Observations |